Sustainability

ESG Essentials for Corporates #3: The science behind climate change

Global warming, climate change and the worldwide effort to reduce greenhouse gas emissions have become prominent issues in the wider public perhaps even more so – in the corporate world.

Climate change and the science behind it

While there’s a common understanding of the urgency to tackle climate change, some confusion and questions remain about, for example, the human impact on climate change, the thinking behind the 2 °C limit for global warming and how a rising global temperature affects our planet.

Implementing climate action measures requires businesses and all other stakeholders to understand the scientific realities, hence we’ll be covering in this and the two following articles of our “ESG Essentials for Corporates” series climate change basics, which are relevant to corporate decision makers, but also to anyone else.

Jargon buster

GHG: Greenhouse gases trap the sun’s heat. They include carbon dioxide, methane, nitrogen oxide and chlorofluorocarbons.

WMO: The World Meteorological Organization is the United Nations’ specialist agency for meteorology (weather and climate), operational hydrology and related geophysical sciences.

Intergovernmental Panel on Climate Change (IPCC): A committee of climatologists, meteorologists, geographers and other scientists, established in 1988 by the WMO and the United Nations Environment Programme (UNEP) to assess the science related to climate change.

UNFCCC: The United Nations Framework Convention on Climate Change is an international environmental treaty negotiated at the United Nations Conference on Environment and Development in 1992. Its objective is to "stabilize greenhouse gas concentrations in the atmosphere at a level that would prevent dangerous anthropogenic interference with the climate system." 

The long history of climate science and modelling

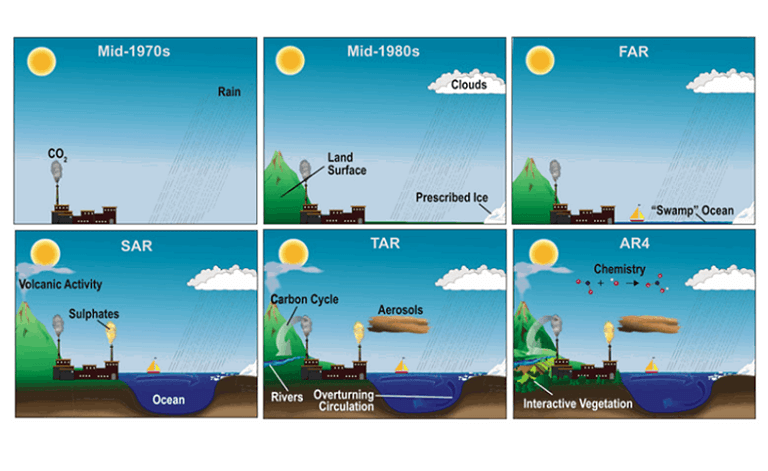
Since the 19th century, climatologists and other scientists have contributed to a better understanding of our climate system, collecting and feeding a vast amount of monitoring data into complex computer models, which show how variations in contributing climate factors affect each other and how any climate changes affect ecosystems and human life.

Two key discoveries: in 1861, Irish physicist, John Tyndall, recognised the natural greenhouse effect and suggested that changes in the atmospheric composition could result in climatic variations. The natural greenhouse effect is caused by so-called greenhouse gases (GHG), which occur naturally in the atmosphere. GHG trap the sun’s heat that reflects back up into the atmosphere, acting like the insulating glass walls of a greenhouse. Without the natural greenhouse effect our planet would be too cold to support life, however, a higher concentration of GHG causes the earth to heat up too much.

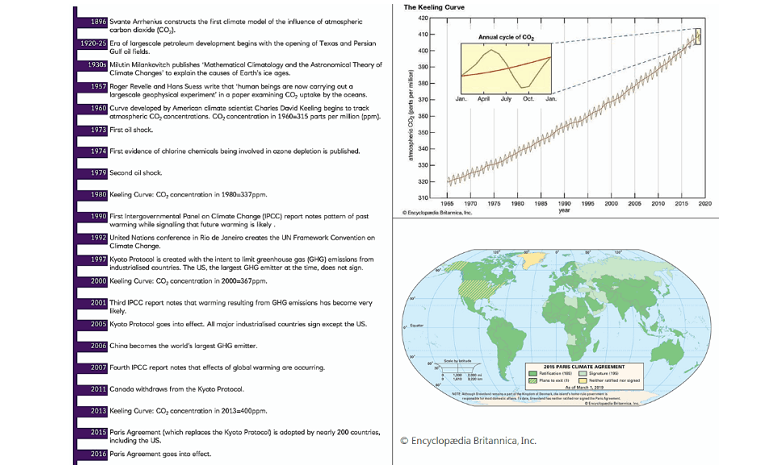
In 1896, Swedish chemist, Svante Arrhenius, created the first model that measured the influence of carbon dioxide, the most prominent of the GHGs, in the atmosphere and found that an increase or decrease of the quantity of CO2 results in an increases or decrease in the global temperature in nearly arithmetic progression.

Timeline of Climate Change

Today’s climate models combine data from 10-15 big global climate modelling centres

Simply speaking, climate modelling is an extension of weather forecasting, but focusing on changes over decades rather than hours – therefore, today’s climate models have taken many years and many teams of scientists to build and improve, with a typical global climate model containing enough computer code to fill about 18,000 pages of printed text.

Climate models generate a nearly complete picture of the Earth’s climate, which scientists use to run many different experiments to simulate climates of the past, present and future and altering variables to find answers to questions such as what happens with the climate when GHG concentrations increase.

Over time, climate models have become vastly more complex, gradually adding more components. The most recent subset of global climate models is incorporating biogeochemical cycles – the transfer of chemicals between living things and their environment. Such “Earth System Models” can simulate, amongst other things, the carbon cycle or nitrogen cycle, as well as changes in vegetation and land use and how they interact with the climate system.

Climate Model

This diagram explicitly references the National Center for Atmospheric Research’s (NCAR) Community Climate System Model (CCSM), but the principles apply to other climate models.

Crown Copyright Met Office

Key climate reports aggregate climate model finding

The IPCC is a major publisher of climate reports: The panel of climate scientists provides regular “Assessment Reports”, summarising the state of knowledge on climate change.

In its latest Fifth Assessment Report the IPCC concluded, that there’s a probability of more than 95% that human-produced GHGs have caused much of the observed increase in Earth’s temperatures over the past 50 years. It also found that industrial activities have raised atmospheric carbon dioxide levels from 280 parts per million to 412 parts per million in the last 150 years. Before the Industrial Revolution, the levels fluctuated naturally over many thousands of years but had never exceeded 300 parts per million at any point in the last 800,000 years.

On request by the UNFCCC, after the adoption of the Paris Agreement, the IPCC produced a special report published in 2018 “Global Warming of 1.5°C”, which assessed what a 1.5°C warmer world would look like, and also outlined the different pathways by which global temperature rise could be limited to 1.5°C.

This report as well as other IPCC reports – the latest covered climate change and land use in 2019 – has underpinned climate policy decisions on national and international scales for the years.

Likewise, the WMO publishes regular climate change reports, making headlines with its “Global Climate Report 2015-2019”, in which it stated that the 2015-2019 period is likely to be the warmest of any other on record globally, with a 1.1 °C global temperature increase since the pre-industrial period and a 0.2 °C increase compared to 2011-2015. It also found that during this period carbon emissions continued to increase the atmospheric concentration of major GHGs by 20% compared to the previous five years (2011-2015).

Global warming and its ecological impact

While there’ve been natural fluctuations in the climate throughout history, scientists have measured that most of the warming has occurred in the past 35 years, with the six warmest years on record taking place since 2014.

Global warming has increased the frequency and intensity of droughts in a number of regions – such as the Mediterranean, West- and North-Eastern Asia, many parts of South America and much of Africa – and has also caused significantly heavier precipitation globally. Heat waves counted as the deadliest meteorological hazard, affecting all continents and resulting in new temperature records in many countries. The 2019 northern summer saw record-breaking wildfires that expanded to the Arctic regions, and widespread fires in the Amazon rainforest.

And other climate modelling findings are sending out further strong warnings:

Melting ice:Greenland has lost an average of 286 billion tons of ice per year between 1993 and 2016, while Antarctica lost about 127 billion tons per year during the same period, with the rate of Antarctica ice-mass loss tripling in the last decade.

Sea level rise: The global sea level has risen about 8 inches in the last century. The rate in the last two decades is nearly double that of the last century and is accelerating slightly every year.

Loss of biodiversity: One million animal and plant species are threatened with extinction, many within decades, more than ever before in human history. More than 40% of amphibian species, almost 33% of reef-forming corals and more than a third of all marine mammals are at risk of becoming extinct.

Annual global temperatures from 1850-2017

© Ed Hawkins: The colour scale represents the change in global temperatures covering 1.35°C [data]

The rationale behind the 2°C temperature limit

The origin of the 2°C temperature limit doesn’t stem from the climate science community but was introduced by American economist and Nobel prize winner William Nordhaus in his 1975 paper “Can we Control Carbon Dioxide?” He suggested it would be reasonable to keep climatic variations within the normal range of climatic variation and concluded that a reasonable upper limit would be the temperature increase one would observe from a doubling of preindustrial CO2 levels. He believed this equated to a temperature increase of about 2°C.

Climate scientists began supporting the idea of a limit of 1°C or 2°C, showing that climate change risks increase with temperatures over 1°C and grow substantially with additional warming. In 1990, the Stockholm Environmental Institute argued in a report, that limiting the temperature rise to 1°C would be the safest option, but was probably unrealistic to achieve and therefore 2°C would be the next best limit.

The 2°C limit eventually moved into the policy and political world when the EU’s Council of Ministers adopted it in 1996 and the UN in 2010. In 2015 the Paris Agreement postulated 2°C as the upper limit, with a desire to limit warming to 1.5°C.

But how far would the global temperature rise without intervention? Climate models predict that the global temperature would reach 4°C above pre-industrial levels by the close of the current century if global emissions continue unabated at their current rate – with dramatic consequences for our planet; which we look at in the next article of our “ESG Essentials for Corporates” series.

The pandemic’s effect – are we closer to keeping global warming at bay?

The positive environmental effects of the lockdown in the wake of COVID-19 have made headlines throughout the pandemic. Indeed, carbon dioxide emissions significantly dropped during that period, with energy demand – a major cause for GHG emissions – decreasing due to behavioural changes to travel, commuting and working habits, and a lower economic output lessening demand for fossil fuels. Furthermore, experts forecast that CO2 emissions most likely have already peaked in 2019 and will now steadily continue to drop.

However, scientists agree that even the pandemic’s dampening effect on emissions is still nowhere near what’s required to deliver on the Paris Agreement’s goal of keeping global warming well below 2°C above pre-industrial levels. In fact, to reach the 1.5°C target, emissions would have to decline by as much as we’ve experienced in 2020 every year from now on. So far, the drop in emissions during the pandemic has only bought us another year of ‘allowable’ emissions, if at all, before the 1.5°C target is exhausted (in 2029).

Still, there’s positive news: COVID-19 has shown that measures can be implemented fast if there’s an emergency – exactly what’s needed to scale up already existing, smart, clean technologies that can help to keep global warming at bay.

This article has been prepared for information purposes only, does not constitute an analysis of all potentially material issues and is subject to change at any time without prior notice. NatWest Markets does not undertake to update you of such changes.  It is indicative only and is not binding. Other than as indicated, this article has been prepared on the basis of publicly available information believed to be reliable but no representation, warranty, undertaking or assurance of any kind, express or implied, is made as to the adequacy, accuracy, completeness or reasonableness of the information contained in this article, nor does NatWest Markets accept any obligation to any recipient to update or correct any information contained herein. Views expressed herein are not intended to be and should not be viewed as advice or as a personal recommendation. The views expressed herein may not be objective or independent of the interests of the authors or other NatWest Markets trading desks, who may be active participants in the markets, investments or strategies referred to in this article. NatWest Markets will not act and has not acted as your legal, tax, regulatory, accounting or investment adviser; nor does NatWest Markets owe any fiduciary duties to you in connection with this, and/or any related transaction and no reliance may be placed on NatWest Markets for investment advice or recommendations of any sort. You should make your own independent evaluation of the relevance and adequacy of the information contained in this article and any issues that are of concern to you.

This article does not constitute an offer to buy or sell, or a solicitation of an offer to buy or sell any investment, nor does it constitute an offer to provide any products or services that are capable of acceptance to form a contract. NatWest Markets and each of its respective affiliates accepts no liability whatsoever for any direct, indirect or consequential losses (in contract, tort or otherwise) arising from the use of this material or reliance on the information contained herein. However this shall not restrict, exclude or limit any duty or liability to any person under any applicable laws or regulations of any jurisdiction which may not be lawfully disclaimed.

NatWest Markets Plc. Incorporated and registered in Scotland No. 90312 with limited liability. Registered Office: 36 St Andrew Square, Edinburgh EH2 2YB. Authorised by the Prudential Regulation Authority and regulated by the Financial Conduct Authority and Prudential Regulation Authority. NatWest Markets N.V. is incorporated with limited liability in the Netherlands, authorised and regulated by De Nederlandsche Bank and the Autoriteit Financiële Markten. It has its seat at Amsterdam, the Netherlands, and is registered in the Commercial Register under number 33002587. Registered Office: Claude Debussylaan 94, Amsterdam, the Netherlands. Branch Reg No. in England BR001029. NatWest Markets Plc is, in certain jurisdictions, an authorised agent of NatWest Markets N.V. and NatWest Markets N.V. is, in certain jurisdictions, an authorised agent of NatWest Markets Plc. NatWest Markets Securities Japan Limited [Kanto Financial Bureau (Kin-sho) No. 202] is authorised and regulated by the Japan Financial Services Agency. Securities business in the United States is conducted through NatWest Markets Securities Inc., a FINRA registered broker-dealer (http://www.finra.org), a SIPC member (www.sipc.org) and a wholly owned indirect subsidiary of NatWest Markets Plc.

Copyright 2022 © NatWest Markets Plc. All rights reserved.

scroll to top